

Cap Rate vs. Cash on Cash Return: Master the Multifamily Metrics That Matter in 2026
In a 2026 market where multifamily mortgage rates are fluctuating between 5.41% and 12.75%, relying on a single metric to justify your purchase is the fastest way to go broke. You’re likely feeling the pressure of analysis paralysis as you stare at spreadsheets, trying to settle the cap rate vs cash on cash return multifamily debate before you overpay for a Class B asset just because the numbers look "standard." It’s frustrating to watch your potential take-home profit evaporate because you don’t fully grasp how today’s debt environment impacts your bottom line.
You deserve a strategy that turns data into a weapon for wealth. This guide is your 90-day blueprint to total clarity. You’ll master these critical metrics so you can stop guessing and start making offers with the authority of a seasoned pro. We are breaking down the exact framework to filter winning deals, showing you how to leverage debt for higher returns even when interest rates feel like a hurdle. It’s time to stop analyzing and start acquiring. Your path to economic empowerment starts right here. Let’s build your empire.
Key Takeaways
- Master the distinction between unleveraged property yield and your actual pre-tax profit. This clarity is the first step toward building a recession-proof portfolio.
- Identify "Negative Leverage" before it destroys your returns. Learn why financing can be your greatest ally or your biggest threat in the 2026 interest rate climate.
- Adopt a strategic 90-day framework to master the cap rate vs cash on cash return multifamily analysis. Stop guessing and start filtering deals like an institutional pro.
- Discover how to use Trailing 12-Month (T-12) data to find the "True" NOI. Accurate underwriting is the only way to avoid overpaying for a property.
- Leverage the Multifamily Tool Kit to automate your math and secure your first apartment building within 90 days.
The Fundamentals: Cap Rate vs. Cash on Cash Return Explained
Success in multifamily investing isn't about luck; it's about mastering the math that others ignore. To win in 2026, you must distinguish between how a property performs and how your investment performs. These are two different worlds. You need to understand the fundamental mechanics in the cap rate vs cash on cash return multifamily debate to avoid the traps that sink amateur investors. Think of the cap rate as the property's pulse and the cash on cash return as your personal oxygen supply; both are the vital signs of any apartment deal.
The Capitalization Rate, or cap rate, represents the property’s unleveraged yield. It tells you what the return would be if you bought the building with 100% cash. It ignores the bank entirely. On the other hand, Cash on Cash (CoC) return measures your actual pre-tax profit relative to the specific dollars you move out of your bank account. While cap rate measures the efficiency of the asset, CoC measures the efficiency of your strategy. If you want to scale fast, you must master both.
The Cap Rate Formula: Measuring Property Efficiency
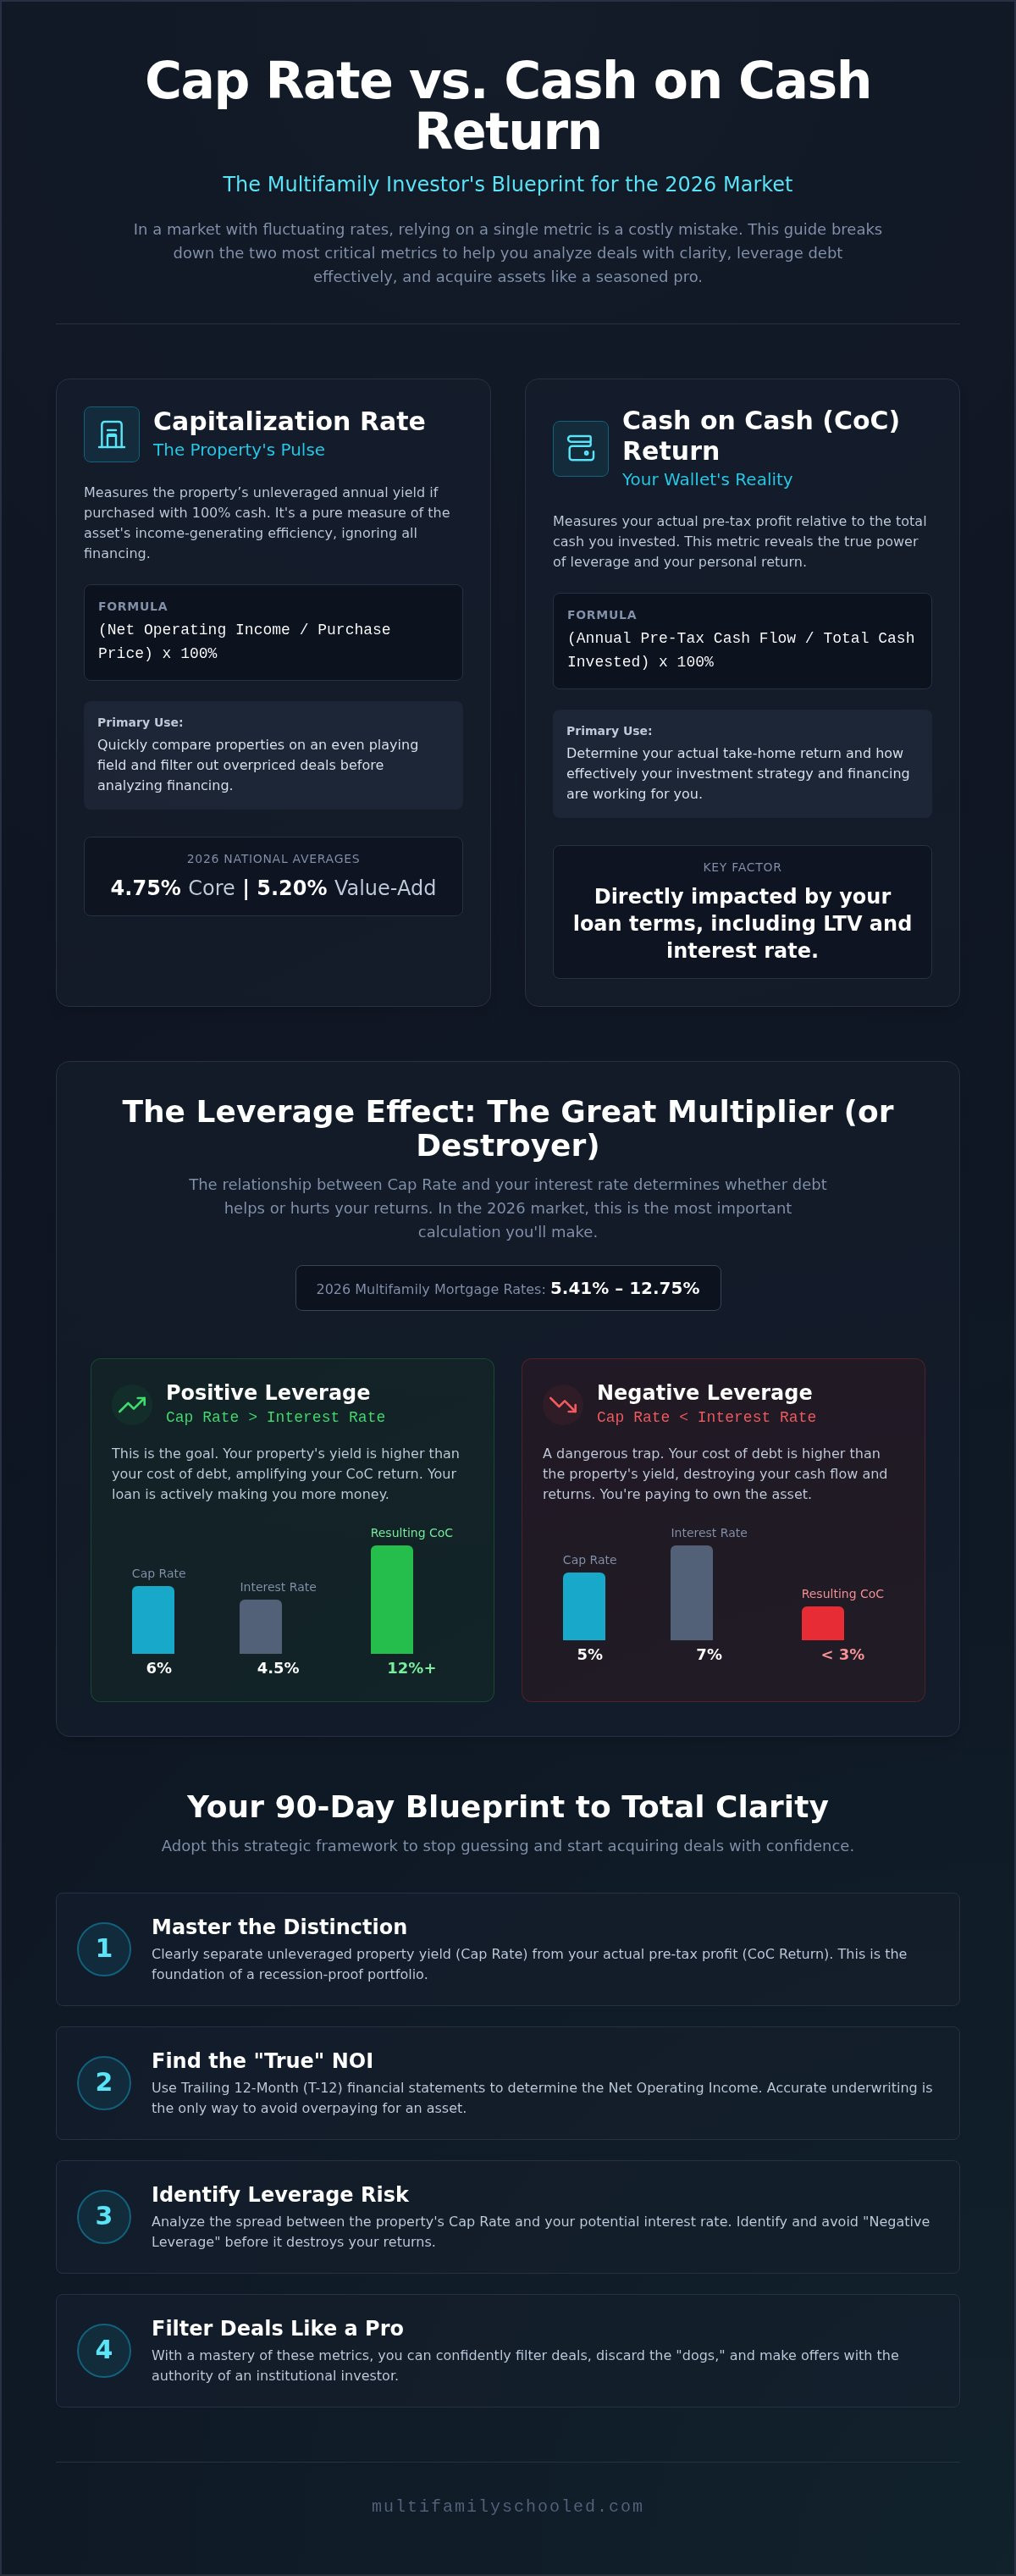
The formula is simple: Net Operating Income (NOI) divided by the Purchase Price. This number serves as a direct proxy for risk and market demand. A lower cap rate usually indicates a high-demand, low-risk "Class A" asset in a Tier 1 city. Conversely, a higher cap rate suggests a higher-risk "Class C" property where you're compensated for the headaches of older infrastructure or tougher neighborhoods. For example, as of June 2026, national average cap rates for core properties sit at 4.75%, while value-add assets average 5.20%.
Using the Capitalization rate allows you to compare properties across different markets on an even playing field. It strips away the variables of debt, letting you see which building actually generates more income per dollar of value. Use this to filter out overpriced "dogs" before you even look at a loan application. If the cap rate doesn't align with the market standard for that asset class, walk away.
The Cash on Cash Formula: Measuring Your Wallet
This is the metric that determines your lifestyle and freedom. The formula is your Annual Pre-Tax Cash Flow divided by your Total Cash Invested. This includes your down payment, closing costs, and immediate capital expenditures. While the cap rate tells you about the building, CoC tells you how much money is actually hitting your pocket every month. It reveals the true power of leverage. By using debt correctly, you can achieve a CoC return that far exceeds the property's cap rate.
In a 2026 environment where mortgage rates can hit 6% or higher, your CoC calculation is your ultimate reality check. It forces you to account for the cost of your loan. If you aren't using a professional tool like the Multifamily Tool Kit to run these numbers, you are guessing with your future. Stop guessing. Calculate your wallet's reality and secure your freedom.
The Leverage Effect: Why Financing Changes Everything
Leverage is the engine that drives your multifamily portfolio. In the 2026 market, understanding the spread between your borrowing cost and your yield is the difference between generational wealth and a failed investment. When your property's cap rate is higher than your interest rate, you achieve "Positive Leverage." This is the secret sauce that allows a modest 6% cap rate property to transform into a 12% Cash on Cash return. However, if your interest rate climbs above your yield, you enter "Negative Leverage." Debt starts eating your profit. You're essentially paying the bank for the privilege of owning the building.
Current 2026 interest rates have tightened the gap significantly. With multifamily mortgage rates ranging from 5.41% to 12.75%, the margin for error is razor-thin. You cannot afford to guess. You must analyze the relationship of Cap Rate vs. Cash on Cash Return to ensure your debt is working for you. In a market where bridge debt often prices at SOFR plus 500 basis points, your underwriting must be flawless to avoid the trap of negative leverage. Debt is the high-octane engine, but the property remains the fuel.
Debt: The Great Multiplier
Your Loan-to-Value (LTV) ratio directly dictates your CoC. Higher leverage skyrocket returns in a positive leverage scenario because you're using less of your own money to capture the same income. Many professionals use interest-only periods to maximize early-year cash flow and boost their initial CoC. But look at the data before you dive in. High leverage increases your risk profile. If the property's performance dips, your debt service remains fixed. Looking at both metrics prevents you from over-leveraging into a disaster. If you want to see how these numbers look on your own potential deals, check out our Mentorship Program for expert guidance.
Cap Rate vs. CoC: A Side-by-Side Comparison
See how financing shifts the math in a real-world scenario. In this example, a property generates $70,000 in NOI on a $1,000,000 purchase price, resulting in a 7% Cap Rate. Notice how the property efficiency stays the same, but your personal return changes based on the debt.
| Metric | 100% Cash Deal | 75% Debt Deal (5.5% Int) |
|---|---|---|
| Purchase Price | $1,000,000 | $1,000,000 |
| Cash Invested | $1,000,000 | $250,000 |
| Cap Rate | 7% | 7% |
| Pre-Tax Cash Flow | $70,000 | $28,750 |
| CoC Return | 7% | 11.5% |
The Cap Rate remains static while the CoC fluctuates wildly based on the financing structure. This is why mastering the cap rate vs cash on cash return multifamily calculation is non-negotiable for anyone serious about building a portfolio in 2026. You are either the master of the math, or you are a victim of the market.
2026 Market Realities: When to Prioritize Cap Rate vs. CoC
"Are cap rates too low to make money in 2026?" This is the number one objection from investors stuck in analysis paralysis. The answer is a resounding no. You just need to know which metric to prioritize based on the asset class and market tier. In the second quarter of 2026, institutional Class A assets are trading at average cap rates of 4.70%. These luxury properties offer massive stability and long term appreciation but lower immediate cash flow. On the flip side, Class C assets average 5.64%. They offer higher yields but come with higher management intensity. Success in the cap rate vs cash on cash return multifamily debate isn't about finding the highest number; it's about finding the right number for your specific strategy.
The Value-Add Strategy
Amateurs buy based on today's numbers. Pros buy based on tomorrow's potential. In a value-add play, a low entry Cash on Cash return is often a strategic choice. You might buy a property with a 5.20% entry cap rate and near-zero CoC because you see the "Pro Forma" potential. By renovating units and improving operations, you can achieve the 5.38% rent growth seen in repositioned properties this year. This forced appreciation creates a massive jump in your CoC after the first 12 to 24 months. Your exit cap rate is the most important number in your 5-year plan. If you compress the cap rate through better management, your total return will dwarf any initial cash flow concerns.
Filtering by Market Tier
Location still dictates your ceiling. A 4.5% cap rate in a high-growth growth market like Austin or Phoenix often beats an 8% cap rate in a dying town with declining population. Tier 1 markets offer lower caps but higher appreciation and liquidity. Tier 2 markets offer the cash flow you need for immediate lifestyle changes. You must align your investment goals with the right metric. Don't waste time manual searching. Use Real Estate Radar AI to identify high-growth zip codes where the spread between cap rates and borrowing costs is most favorable. Stop guessing where the growth is and start using data to drive your 90-day acquisition plan. Whether you want monthly income or a massive exit, the market tier you choose defines your results.
The 2026 market is showing signs of stabilization after a period of high supply. With national vacancy rates at 6.8%, your ability to filter deals by market tier is your greatest competitive advantage. If you want a clear framework for these decisions, our Mentorship Program provides the exact blueprint to follow. Mastery is a choice. Choose to lead.
The 90-Day Filter: Analyzing Deals Like a Pro
To secure a property in 90 days, you cannot afford to be a "spreadsheet hobbyist." You must be an execution specialist. The market doesn't reward the person who analyzes the most deals; it rewards the person who analyzes the right deals the fastest. This requires a ruthless filtering process that balances the cap rate vs cash on cash return multifamily relationship before you ever sign an LOI. Speed is your leverage. Accuracy is your armor.
Follow this four-step battle plan to filter every deal that hits your desk:
- Step 1: Verify the T-12. Demand the Trailing 12 Months of actual income and expenses. This is the only way to find the "True" NOI. If a seller won't provide it, walk away.
- Step 2: Benchmarking. Calculate the market-standard cap rate for that specific asset class and submarket. Don't compare a Class C in the suburbs to a Class A downtown.
- Step 3: Stress Test Financing. Run multiple financing scenarios. See how a 1% shift in interest rates impacts your Cash on Cash return. This prevents you from buying into a negative leverage trap.
- Step 4: Automate the Math. Use the Multifamily Tool Kit to handle the heavy lifting. Manual entry is for amateurs.
Avoid the Broker Pro Forma Traps
Brokers are paid to sell the dream, not your reality. Never trust an "advertised" cap rate. Brokers often "forget" to include property management fees or capital reserves for future repairs. In 2026, these expenses are non-negotiable. You must normalize the income statement in under 10 minutes by adding back a realistic management fee and a per-unit reserve. If the deal still pencils out after normalization, you have a winner. If it doesn't, you just saved yourself from a million dollar mistake.
Leveraging AI for Speed
The best deals aren't on the MLS. They are off-market, hidden in the data. By using Real Estate Radar AI, you can identify owners likely to sell before they ever call a broker. This gives you the first shot at high cap rate potential in growth markets. Speed in analysis leads to a deal in 90 days because you're making offers while others are still coloring in their spreadsheets. In 2026, the fastest investor with the best data wins the deal.
Stop playing defense with your future. If you are ready to stop guessing and start acquiring, join our Mentorship Program today and get the exact system we use to close deals every single month.
Master the Math and Secure Your First Deal in 90 Days
Stop playing small. The difference between a multi-millionaire and a frustrated observer is the ability to execute. You've learned the mechanics of the cap rate vs cash on cash return multifamily analysis. Now it's time to put that knowledge into the field. Justin Brennan’s proven system isn't just about theory. It's a battle-tested blueprint designed for speed. We don't just teach you how to look at buildings; we show you how to own them. Our 90-day promise is simple: follow the system and find a deal, or we will find one for you. This is the ultimate performance guarantee for your future.
Theory alone fails every single time. You can memorize formulas, but without real-world deal analysis, you're flying blind. Beginners often fall into "Cap Rate Traps" by ignoring market-specific nuances or failing to account for shifting debt costs in 2026. A mentor acts as your navigator. We look over your shoulder to ensure your underwriting is bulletproof before you risk a single dollar of capital. You need someone who has seen every market cycle and knows exactly where the landmines are buried.
Why Education is Your Best Investment
Calculate the cost of a mistake. A single bad deal can cost you hundreds of thousands in lost equity and operational bleeding. Compare that to the cost of world-class mentorship. It's the cheapest insurance policy you'll ever buy. You gain immediate access to proprietary frameworks and a high-octane network of active investors. This ecosystem bridges the gap from learning to owning in record time. Don't spend years trying to figure it out yourself when the blueprint already exists. Mastery is about following a proven path, not reinventing the wheel.
Your Next Step to Financial Independence
The 2026 market opportunities are here right now. Interest rates are stabilizing and the affordability gap is driving record renter demand. Don't get left behind while others secure their financial independence. Take decisive action. Your journey starts with the right tools. Download the Multifamily Tool Kit today to automate your underwriting and master the cap rate vs cash on cash return multifamily spread. If you're ready for the fast track, apply for our Mentorship Program. The clock is ticking on your 90-day goal. Start now and claim your seat at the table.
Own the Market: Your 90-Day Acquisition Roadmap
The 2026 multifamily landscape doesn't wait for the hesitant. You now have the blueprint to dominate the cap rate vs cash on cash return multifamily analysis and filter deals like a seasoned pro. You understand that while the cap rate defines the property's efficiency, your cash on cash return defines your freedom. Debt is no longer a mystery; it's the high-octane fuel for your wealth engine. You have the formulas, the market context, and the strategic mindset to win.
It's time to bridge the gap between learning and owning. Justin Brennan and our multi-generational team of experts are ready to provide the proprietary AI deal-finding software and the 90-Day Deal Guarantee you need to succeed. Don't let another quarter pass without an asset in your portfolio. Take the leap and secure your financial independence. We've built the system; you just need to execute.
Find Your First Deal in 90 Days-Apply for Mentorship Now!
Success is a system. Follow it and build your legacy today. You've got this.
Frequently Asked Questions
What is a good cap rate for multifamily in 2026?
A good cap rate depends on your goals and the asset class. In 2026, national averages for core multifamily sit at 4.75%, while value-add properties trade closer to 5.20%. Class C assets can reach 5.64%. Target a rate that provides a healthy spread over your borrowing costs. Higher risk properties require higher cap rates to justify the management intensity. Always benchmark against the specific submarket to ensure you aren't overpaying for an asset.
How do interest rates affect my cash on cash return?
Interest rates drive your debt service, which directly reduces your take-home profit. When rates rise, your cash on cash return falls because more income goes to the bank. In 2026, where rates fluctuate between 5.41% and 12.75%, understanding the cap rate vs cash on cash return multifamily dynamic is essential. Use the Multifamily Tool Kit to stress test your financing. This ensures your deal stays profitable even if the debt environment shifts unexpectedly.
Is a 4% cap rate too low for a beginner investor?
A 4% cap rate isn't inherently bad, but it offers zero margin for error for beginners. In growth markets like Austin, Class A assets often trade at these levels because of their stability. However, with 2026 interest rates being elevated, achieving positive leverage at 4% is difficult. You might find better success with Class B or C properties. These assets offer higher entry yields, giving you more breathing room as you learn to manage operations.
What is the difference between cap rate and discount rate?
The cap rate is a snapshot of a property's unleveraged yield at the moment of purchase. It's a tool for comparing asset efficiency. The discount rate is used in a more complex analysis to account for the time value of money over your entire holding period. While the cap rate helps you filter deals today, the discount rate helps you project the total value of future income and the eventual sale. Master both to build a portfolio.
Can a property have a high cap rate but a low cash on cash return?
Yes, this is a common trap in high-interest environments. If you find an 8% cap rate property but your mortgage rate is 9%, you're in negative leverage. The debt eats your profit, resulting in a tiny CoC. Also, if a deal requires massive upfront renovations, your total cash invested spikes. This lowers your return. Mastering the cap rate vs cash on cash return multifamily relationship prevents you from buying high-yield buildings that actually lose money.
How do I find the market cap rate for a specific city?
Find the market cap rate by analyzing recent sales of similar assets in that specific submarket. Don't rely on national averages alone. Brokers and appraisal reports offer clues, but proprietary tools like Real Estate Radar AI provide the most accurate, real-time data. This technology helps you see off-market trends and actual transaction prices. Knowing the true market rate ensures you make competitive offers that sellers take seriously without over-leveraging your own capital.
Why do brokers often advertise higher cap rates than what is real?
Brokers often use "Pro Forma" projections instead of Trailing 12-Month reality to inflate the property's appeal. They might exclude property management fees or capital reserves from the calculation. This creates an advertised cap rate that is much higher than the actual yield. You must normalize every income statement to find the True NOI. Never trust a marketing flyer. Accurate underwriting is your only protection against overpaying for a building that underperforms.
What is a good cash on cash return for an apartment building?
Targeting a double-digit return, typically between 8% and 12%, is a standard goal for serious investors. However, your target should align with the market tier. In Tier 1 growth cities, you might accept a 6% return for higher appreciation potential. In Tier 2 income markets, you should demand more. Our mentorship program teaches you how to structure deals that hit these targets consistently. Stop guessing and start using a proven system for building wealth.